Data Visualization is an essential component of your skillset as a Data Scientist or Data Analyst. Data Visualization is basically a form of Visual communication.
ggplot2 is a plotting package that helps us to create complex plots from data in data frame.
ggplot2 functions built step by step by adding new elements
Install ggplot2 package
# install ggplot2

install.packages(ggplot2)
Load ggplot2 package
# include ggplot2 library

library(ggplot2)
During this discussion, we are going to use mtcars package for the dataset.
Note:
The matcars dataset contains information about 32 cars from 1973 motor trends magazine. The dataset is small but contains a variety of continuous and categorical variables.
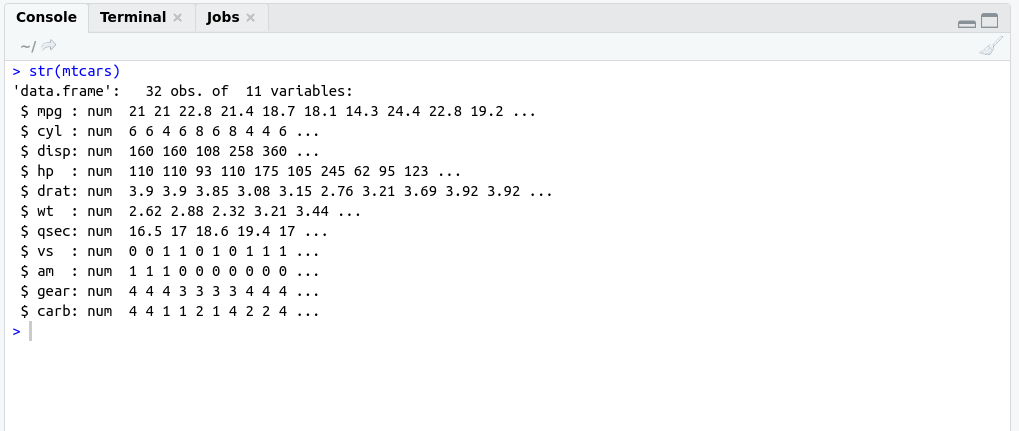
Before describing ggplot2 in more detail just have a look mtcars dataset using str() command.
#structure of matcarsbasically
str(mtcars);
OutPut:
Have a look ggplot2 example
Example:
# include ggplot2 library
library(ggplot2)
ggplot(mtcars , aes(x=wt, y=mpg))+geom_point()
OutPut:

Some points regarding ggplot2ppp
- VisualizationVisual elements in ggplot2 are called geoms (as in geometric objects bars, points …)
- The appearance and location of these geoms (size, color) are controlled by aesthetic properties.basicallybasically
- aesthetic properties are shown by aes()
- Variable that you want to plot is represented by aes() as shown in the previous example.
| Goem layer | Description |
|---|---|
| geom_bar() | Create a layer with bars representing different statistical properties. |
| geom_point() | Create a layer with data points. |
| geom_line() | Create a layer with a straight line. |
| geom_smooth() | Create a layer with smoother. |
| geom_histogram() | Create a layer with a histogram. |
| geom_blogplot() | Create a layer with text in it. |
| geom_text() | Create a layer with a text in it. |
| geom_error_bar() | Create a layer with error bars in it. |
| geom_hline and geom_vline() | Create a layer with a user-defined horizontal and vertical line respectively. |
How to derive iris.tidy from iris?
library(tidyr)
#Convert iris to iris.tidy using tidy function
iris.tidy <- iris %>%
  gather(key, Value, -Species) %>%
  separate(key, c("Part", "Measure"), "\\.")

print(head(iris.tidy))
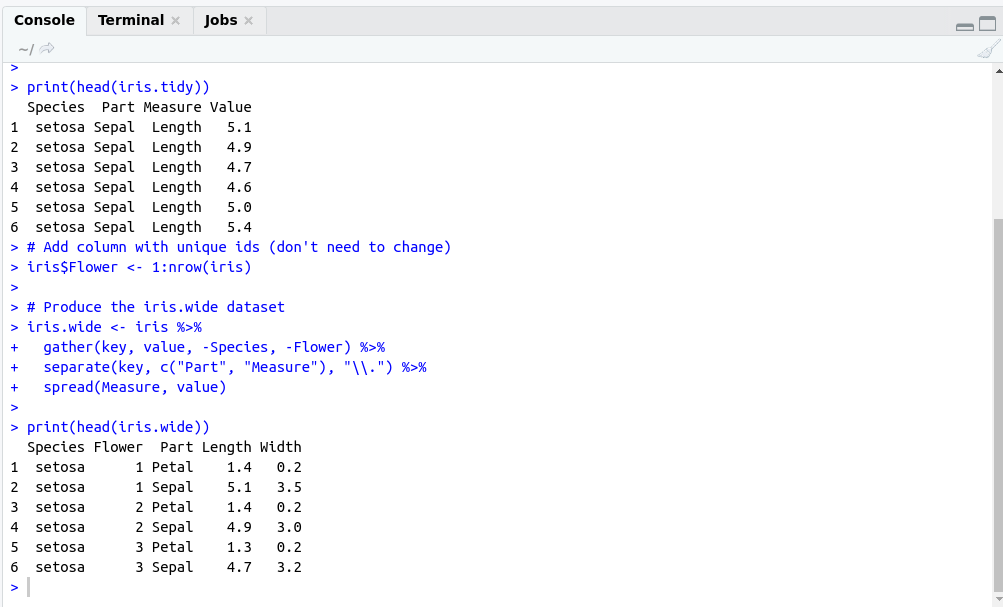
How to derive iris.wide from iris?
# Load the tidyr package
library(tidyr)
# Add column with unique ids (don't need to change)
iris$Flower <- 1:nrow(iris)
# Produce the iris.wide dataset
iris.wide <- iris %>%
  gather(key, value, -Species, -Flower) %>%
  separate(key, c("Part", "Measure"), "\\.") %>%
  spread(Measure, value)
OutPut: