Get Latest CSV file from Folder using Node.js

getLatestFile.js


/***
 * Read lestest file property 
 * 
 */

const fs = require('fs')
async function getLatestFile() {
    const dirPath = '/home/dheeraj/Documents/BlogPost/Downloads';
    let dirCont = fs.readdirSync(dirPath);
    let files = dirCont.filter(function (elm) { return elm.match(/.*\.(csv)/ig); });
    for (let fileP = 0; fileP < files.length; fileP++) {
        let filsStats = fs.statSync(dirPath + "/" + files[fileP]);
        if (new Date(filsStats['birthtime']).getDate() === new Date().getDate() &&
            new Date(filsStats['birthtime']).getMonth() === new Date().getMonth() &&
            new Date(filsStats['birthtime']).getFullYear() === new Date().getFullYear() &&
            new Date(filsStats['birthtime']).getHours() === new Date().getHours() //&& 
        ) {
            return {
                fileName: files[fileP],
                fileLocation: dirPath + "/" + files[fileP]
            };
        }
    }
    return {
        fileName: 'orderFailed.png',
        fileLocation: dirPath + "/" + 'orderFailed.png'
    };
}

Generate test case
getLatestFile.test.js


const {getLatestFile} = require('./getLatestFile')

async function getLatest (){
    let latest = await getLatestFile();
     console.log(latest);
}

getLatest();

OutPut:

Download Code From git Repo

Data visualization Examples in R

In this post, We will explore more examples of Data Visualization using R. For that purpose we are using mtcars as dataset
here is a list of all the features of the observations in mtcars:

  • mpg — Miles/(US) gallon
  • cyl — Number of cylinders
  • disp — Displacement (cu.in.)
  • hp — Gross horsepower
  • drat — Rear axle ratio
  • wt — Weight (lb/1000)
  • qsec — 1/4 mile time
  • vs — V/S engine.
  • am — Transmission (0 = automatic, 1 = manual)
  • gear — Number of forward gears
  • carb — Number of carburetors

Example 1: Plot graph on X and Y axis


# include ggplot2 library
library(ggplot2)

# 1 - Map mpg to x and cyl to y
ggplot(mtcars, aes(x=mpg, y=cyl)) +
  geom_point()

# 2 - Reverse: Map cyl to x and mpg to y
ggplot(mtcars, aes(x=cyl, y=mpg)) +
  geom_point()

OutPut:

Example 2: Change the color, shape, and size of the points


# include ggplot2 library
library(ggplot2)

#chnage color,shape and Size
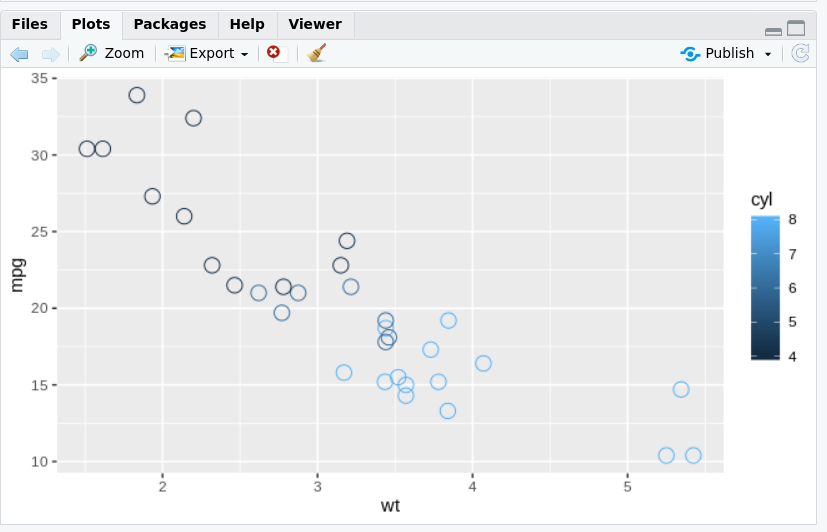
ggplot(mtcars, aes(x=wt, y=mpg, col=cyl)) +
  geom_point(shape=1, size=4)

OutPut:

Example 3: Add alpha and fill


# include ggplot2 library
library(ggplot2)
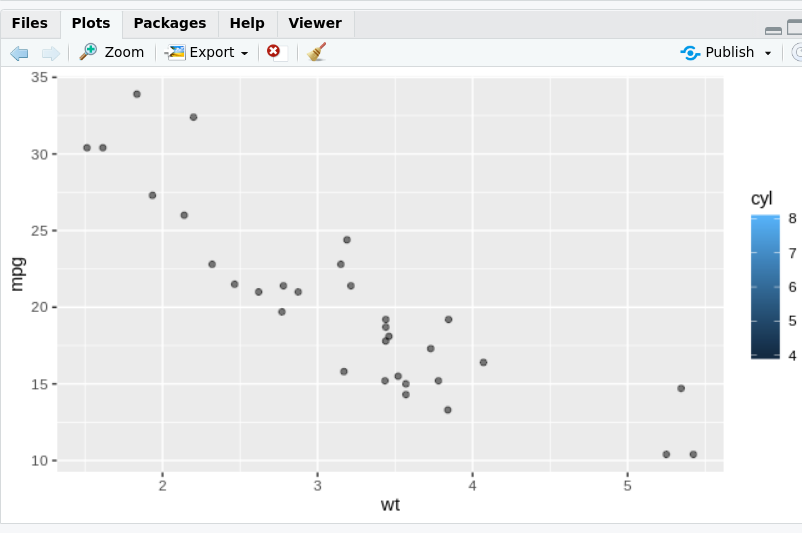
# Expand to draw points with alpha 0.5 and fill cyl
ggplot(mtcars, aes(x = wt, y = mpg, fill = cyl)) +geom_point(alpha=0.5)

OutPut:

Exercise 4: Change Shape and color


library(ggplot2)
# Change shape and color
ggplot(mtcars, aes(x = wt, y = mpg, fill = cyl)) +geom_point(shape=24,col="yellow")

OutPut:

Exercise 5: Change shape and Size


# include ggplot2 library
library(ggplot2)
# Define a hexadecimal color
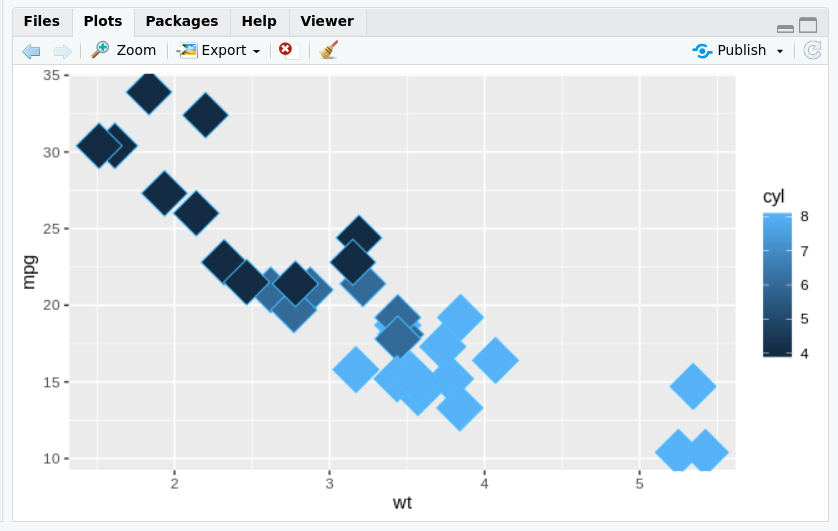
change_color <- "#4ABEFF"
# Set the fill aesthetic; color, size and shape attributes
ggplot(mtcars,aes(x=wt,y=mpg,fill=cyl))+ geom_point(size=10,shape=23,col=change_color)

OutPut:

Explore row data using R

Understanding the structure of your Data

View dimensional

Syntax:


dim()

Example:


# dimensional of mtcars
dim(mtcars)

OutPut:

Looking your DataView dimensional

head()

  • view top of the dataset

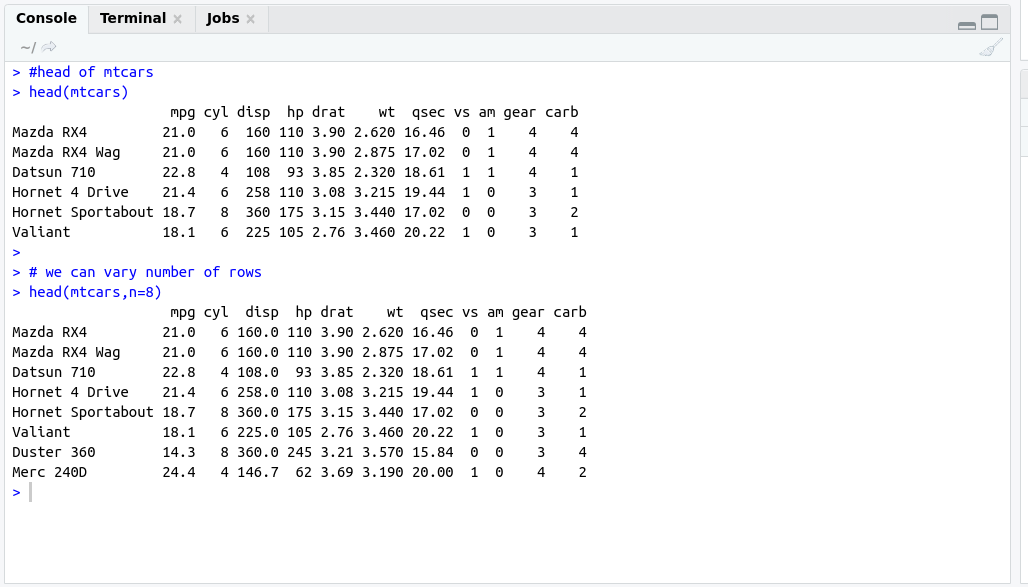
Note: By default, it fetches 6 rows but we can also vary a number of rows.
Syntax:


head()

Example:


#head of mtcars
head(mtcars)
# we can vary number of rows
head(mtcars,n=8)

OutPut:

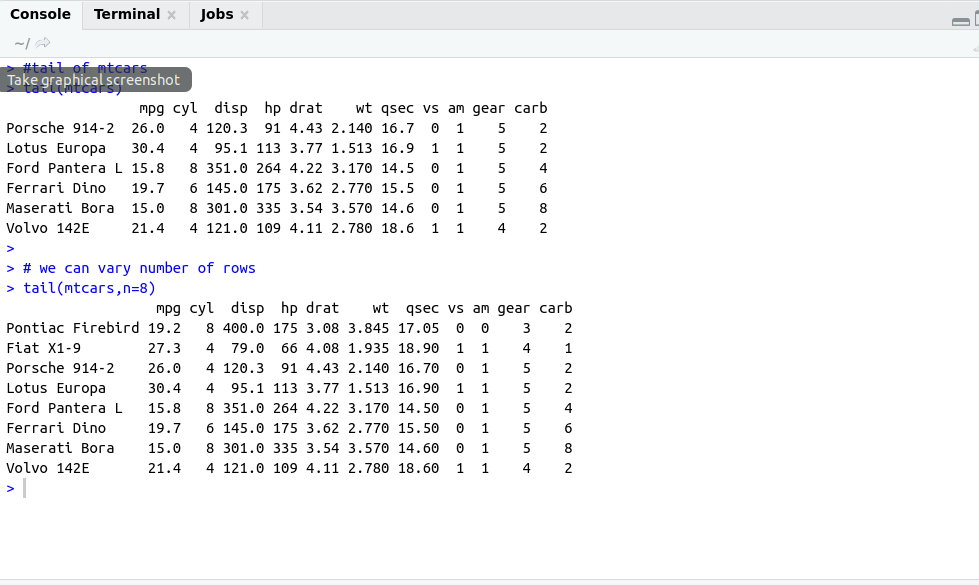
tail()

  • view bottom of the dataset

Example:


#Syntax:tail()
#tail of mtcars
tail(mtcars)

# we can vary number of rows
tail(mtcars,n=8)

Output:
Visualizing your data

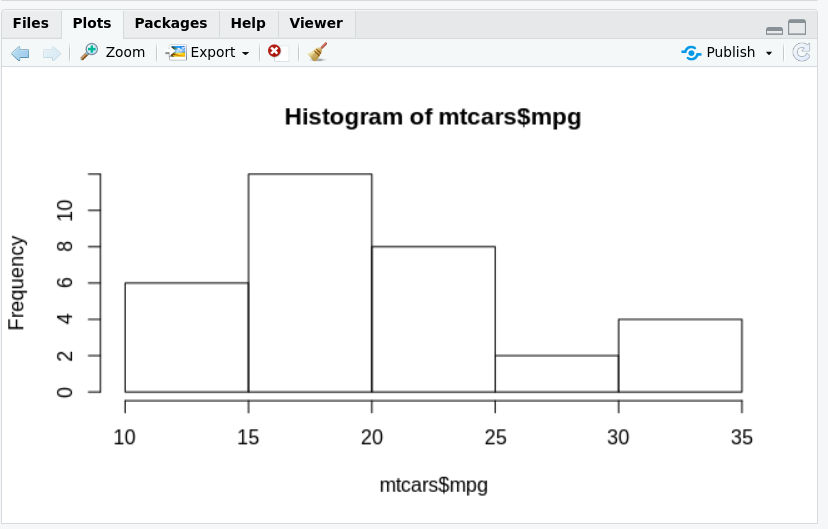
hist()

  • view histogram of a single variable

Example:


Syntax:hist()
#histogram
hist(mtcars$mpg)

OutPut:

plot()

  • view plot of two variables

Example:


Synatx: plot()
#plot
plot(mtcars$mpg,mtcars$qsec)

OutPut:

Gather

  • Gather columns into key-value pairs

Syntax:


gather (data, key, value, ...)
/**
 *
data: a data frame
key: bare name of the new key column
value: bare name of the new value column
*/

Spread

  • Opposite of Gather
  • Spread key-value pairs into columns
  • Takes key-value pairs and spread them into multiple columns

Syntax:


spread(data, key, value)
/**
 *
 data: a data frame
 key: bare name of the column containing keys
 value: bare name of the column containing values
*/

Separating columns

  • The separate() function allows you to separate one column into multiple columns.
  • In the case of separate() function, we can also specify sep as an argument for specifying separator.

Syntax:


seperate(data, column_set, c("column1", "column2"))

Uniting column

  • Opposite of separate is unite

Syntax:


unite(data, column-set, c("column1", "column2"))

Note: we can also specify separator between these two columns

Introduction to Data Visualization in R

Data Visualization is an essential component of your skillset as a Data Scientist or Data Analyst. Data Visualization is basically a form of Visual communication.

ggplot2 is a plotting package that helps us to create complex plots from data in data frame.

ggplot2 functions built step by step by adding new elements

Install ggplot2 package


# install ggplot2

install.packages(ggplot2)

Load ggplot2 package


# include ggplot2 library

library(ggplot2)

During this discussion, we are going to use mtcars package for the dataset.
Note:
The matcars dataset contains information about 32 cars from 1973 motor trends magazine. The dataset is small but contains a variety of continuous and categorical variables.

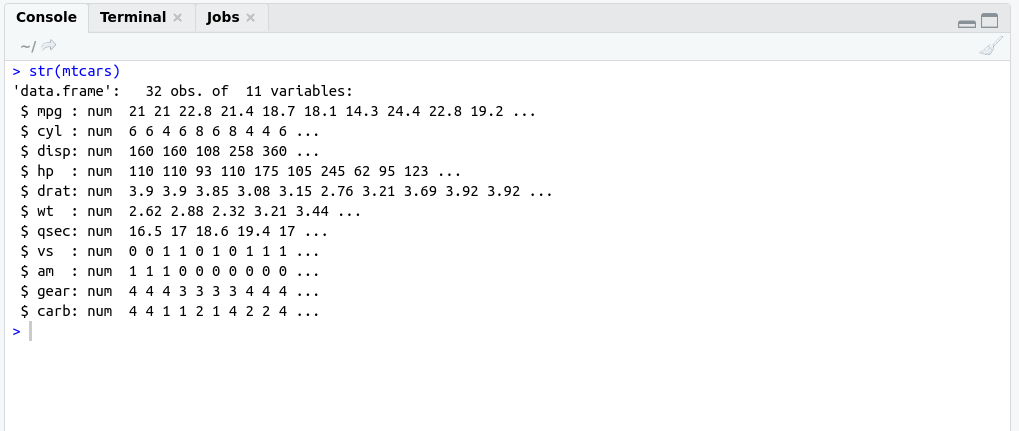
Before describing ggplot2 in more detail just have a look mtcars dataset using str() command.


#structure of matcarsbasically
str(mtcars);

OutPut:

Have a look ggplot2 example 

Example:


# include ggplot2 library
library(ggplot2)
ggplot(mtcars , aes(x=wt, y=mpg))+geom_point()

OutPut:

Some points regarding ggplot2ppp

  • VisualizationVisual elements in ggplot2 are called geoms (as in geometric objects bars, points …)
  • The appearance and location of these geoms (size, color) are controlled by aesthetic properties.basicallybasically
  • aesthetic properties are shown by aes()
  • Variable that you want to plot is represented by aes() as shown in the previous example.
Goem layer Description
geom_bar() Create a layer with bars representing different statistical properties.
geom_point() Create a layer with data points.
geom_line() Create a layer with a straight line.
geom_smooth() Create a layer with smoother.
geom_histogram() Create a layer with a histogram.
geom_blogplot() Create a layer with text in it.
geom_text() Create a layer with a text in it.
geom_error_bar() Create a layer with error bars in it.
geom_hline and geom_vline() Create a layer with a user-defined horizontal and vertical line respectively.

How to derive iris.tidy from iris?


library(tidyr)
#Convert iris to iris.tidy using tidy function
iris.tidy <- iris %>%
  gather(key, Value, -Species) %>%
  separate(key, c("Part", "Measure"), "\\.")

print(head(iris.tidy))

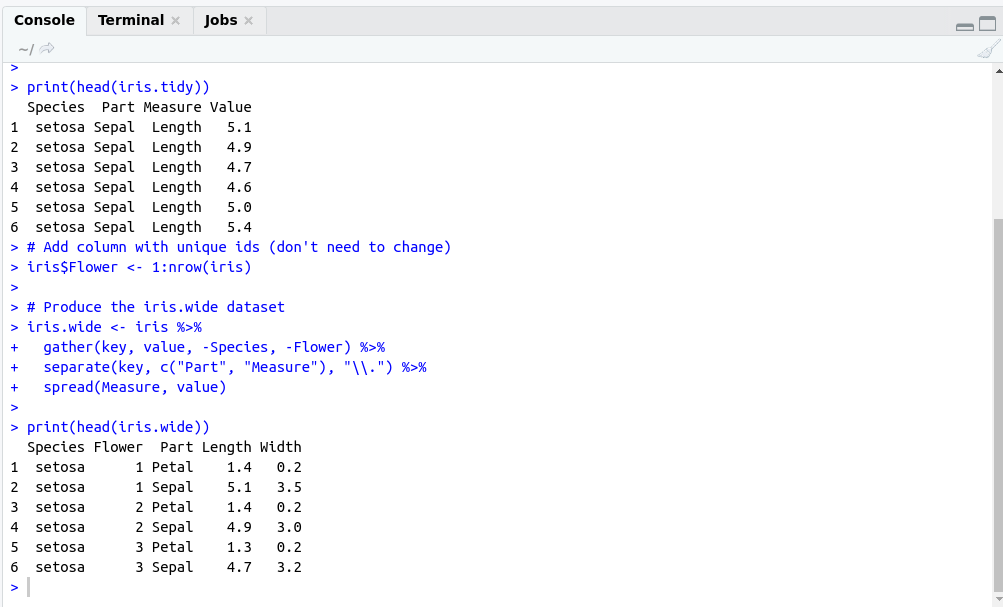
How to derive iris.wide from iris?


# Load the tidyr package
library(tidyr)
# Add column with unique ids (don't need to change)
iris$Flower <- 1:nrow(iris)
# Produce the iris.wide dataset
iris.wide <- iris %>%
  gather(key, value, -Species, -Flower) %>%
  separate(key, c("Part", "Measure"), "\\.") %>%
  spread(Measure, value)

OutPut: